doxa.comunicación | nº 31, pp. 87-105 | 97
July-December of 2020
Alba Córdoba-Cabús and Manuel García-Borrego
ISSN: 1696-019X / e-ISSN: 2386-3978


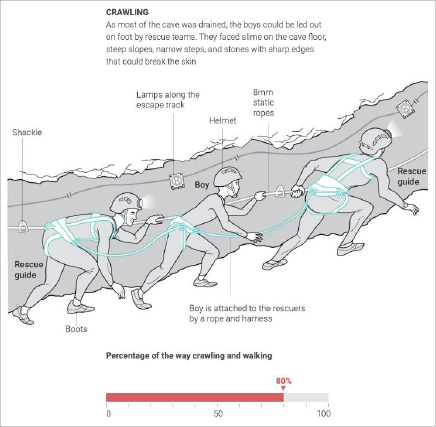
Figure 3: Part of the infographic of the project “How the Thai cave rescue mission unfolded” from the South China Morning Post
3.3. Interactivity of the visualisations
Considering only those projects that incorporate visualisations (n=41), in the sample examined the works with static visual elements predominate (53,66%), ahead of those that use mixed techniques – mixing static and interactive visualisations– (34.14%) and those that are purely interactive –all visual elements allow for interaction– (12.9%).